1. runAW and buildAW
|
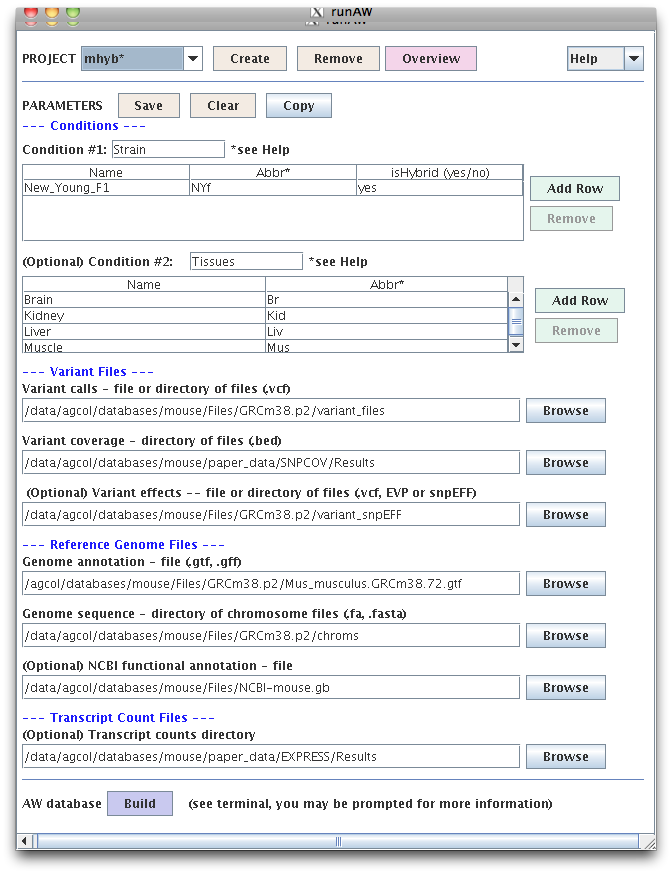
"runAW" creates a configuration file for the project. The "buildAW" program
can be run using the "Build" button, or from the command line.
buildAW checks all files and if they exist and are the right format, it builds the database.
From the command line only, buildAW can be used to add or update the optional data.
|
2. viewAW Overview
|
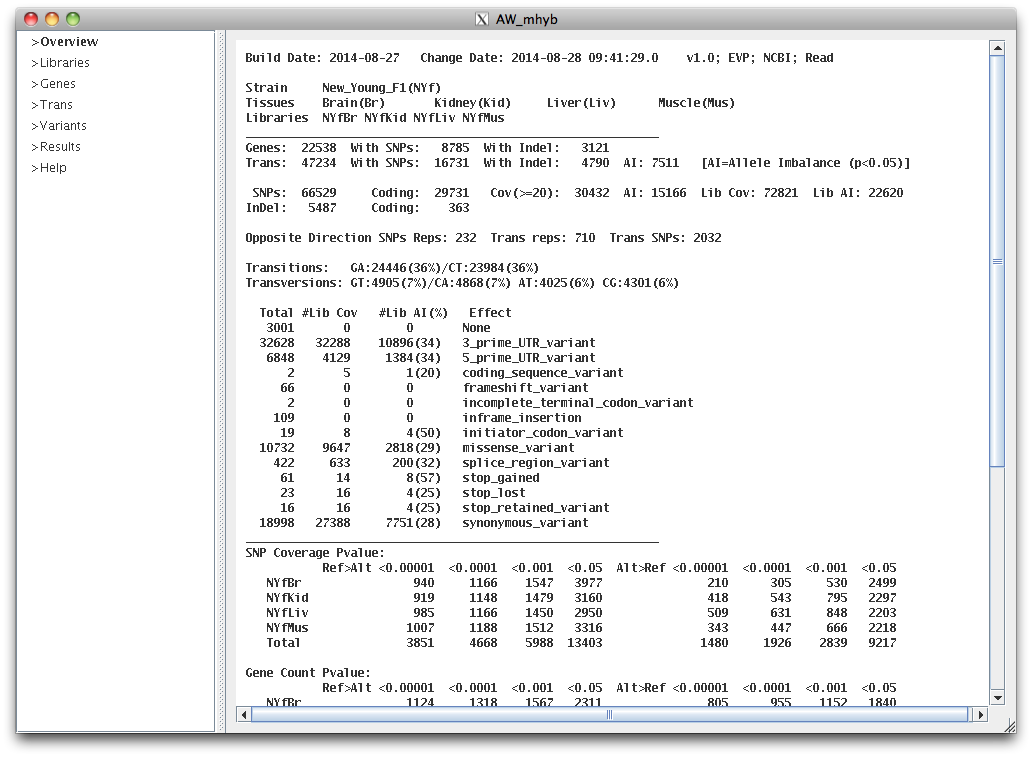
The text in upper right indicates that the variant effects were loaded from an EVP (Ensembl Variant Predictor, McLaren et al. 2010)
file, the optional NCBI annotations were loaded, and the optional read counts were loaded.
If neither the EVP or snpEFF (Cingolani et al. 2012) effects are loaded, "buildAW" will add a subset of the effects (e.g. missense).
|
The line starting with Opposite Direction (OD, i.e. having both ref>alt and alt>ref) indicates the number of SNPs and transcripts with replica counts that were significantly in OD,
and the number of transcripts that have at least two significant AI SNPs (p<0.05) in OD.
| |
3. Transcripts
|
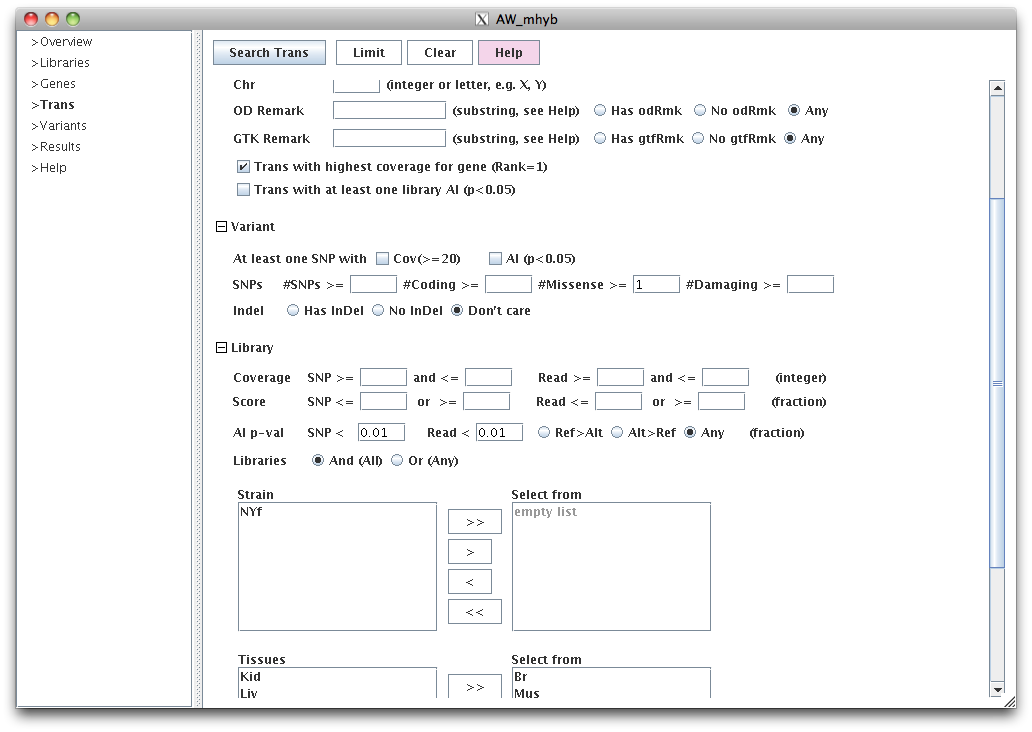
This query will show the best transcript per gene (based on number of reads),
where there is at least one missense SNP, and both SNP coverage and read count are AI (p<0.01) for both
liver and kidney.
SNP coverage refers to the summed values of the SNP coverage.
Read counts are computed by using all reads and only maps
a given read to one transcript using the variants and isoform. By default, the AW pipeline
uses eXpress (Roberts and Pachter 2013) for the assignment.
|
|
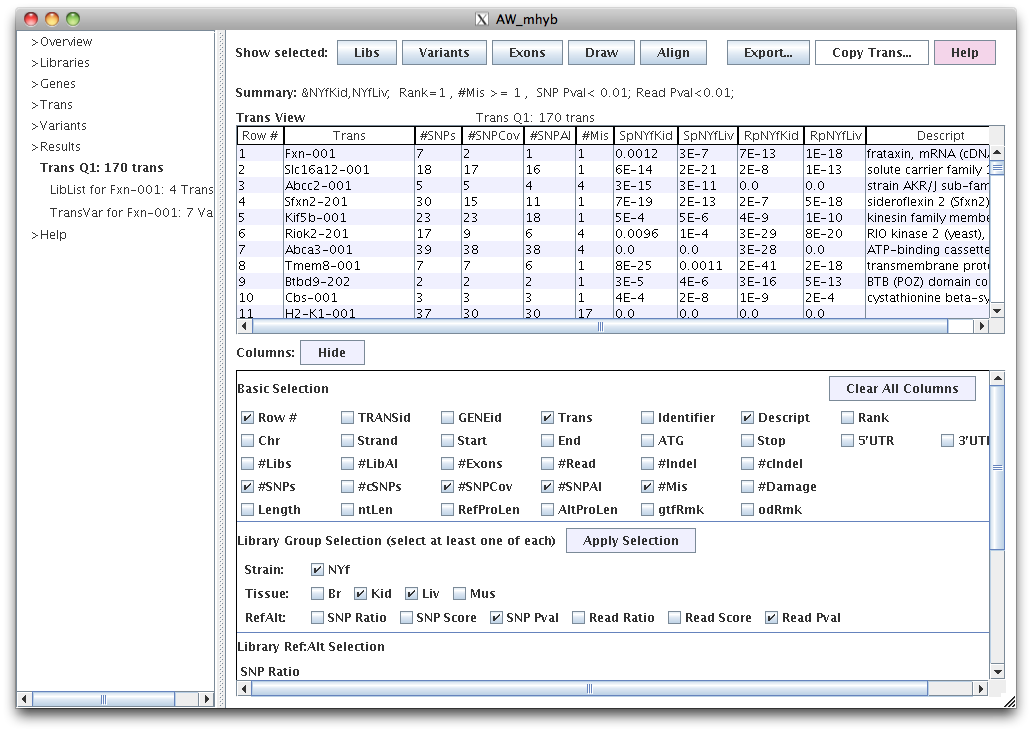
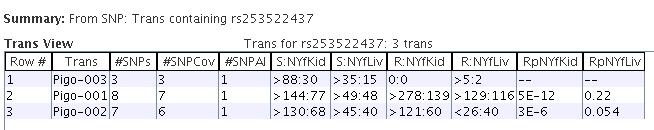
This table was produced by the above Query.
#SNPCov is the number of SNPs with >=20 coverage for at least one library.
#SNPAI is the number of SNPs with AI p<0.05 for at least one library.
#Mis is the number of missense SNPs.
SpNYfKid and SpNYfLiv are the SNP coverage AI p-values.
RpNYfKid and RpNYfLiv are the read count AI p-values.
|
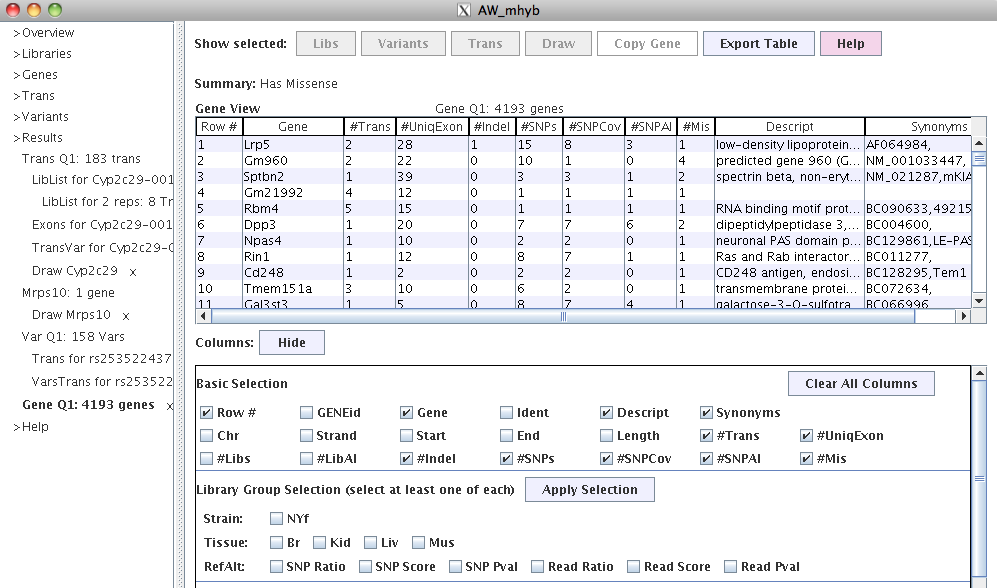
Column can be turned on/off in the bottom panel where checking or unchecking a column has immediate effect.
The panel can be closed with "Hide" to see more of the table. Columns can be moved and sorted.
For the selected transcript(s):
|
Button |
Action
|
Libs
|
Shows a different view of the libraries from which the replicas can be viewed
See the "Libraries and Replicas" section below.
|
Variants
|
Shows the variants for the transcript.
See the "Variant" section below.
|
Exon
|
Shows the exons for the transcript. See the "Exon" section below.
|
Draw
|
Draws the gene for the transcript, which includes all gene isoforms and variants.
See the "Draw" section below.
|
Align
|
Pops-up a window of the alignment of the reference and alternative protein sequences.
|
Export
|
Has a pop-up window that allows the user to choose between exporting the table, or the
sequences of the selected transcripts, or the alignment of the selected transcipts.
|
Copy Trans
|
Copies to the clipboard the transcript name, which can be pasted elsewhere; by right clicking,
it toggles to "Copy Identifier" for copy.
| | | | | | | |
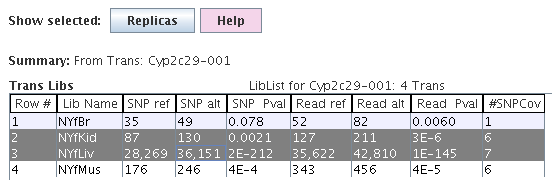
|
The summed SNP coverage values and their p-value are
shown by library.
|
This information can also be viewed in the Trans table, e.g. SNP Ratio, SNP Pval.
|
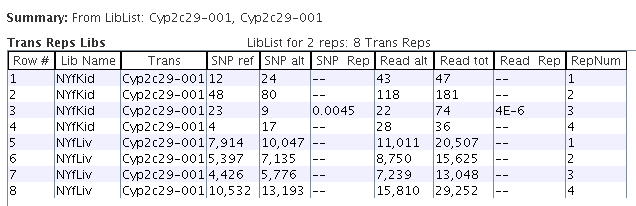
By selecting the NYfLiv and NYfKid rows in the "Trans Libs" table followed by the "Replica" button,
the replica values are shown.
|
The "SNP Rep" column has a p-value for any row where the replicas are significantly in the
opposite direction (OD) from the other replicas in its library, similarity for "Read Rep".
|
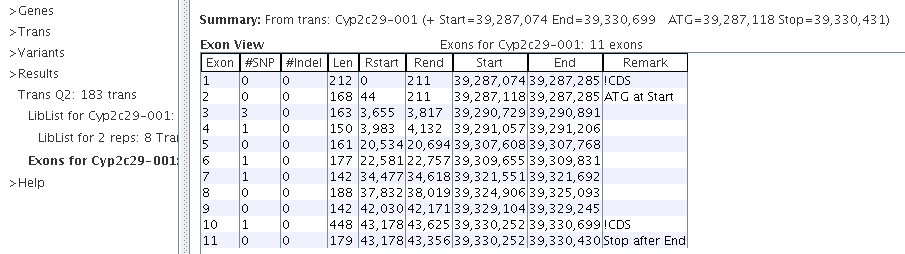
The "!CDS" indicates a non-coding exon. The Rstart and Rend columns are relative to the start of the transcript.
|
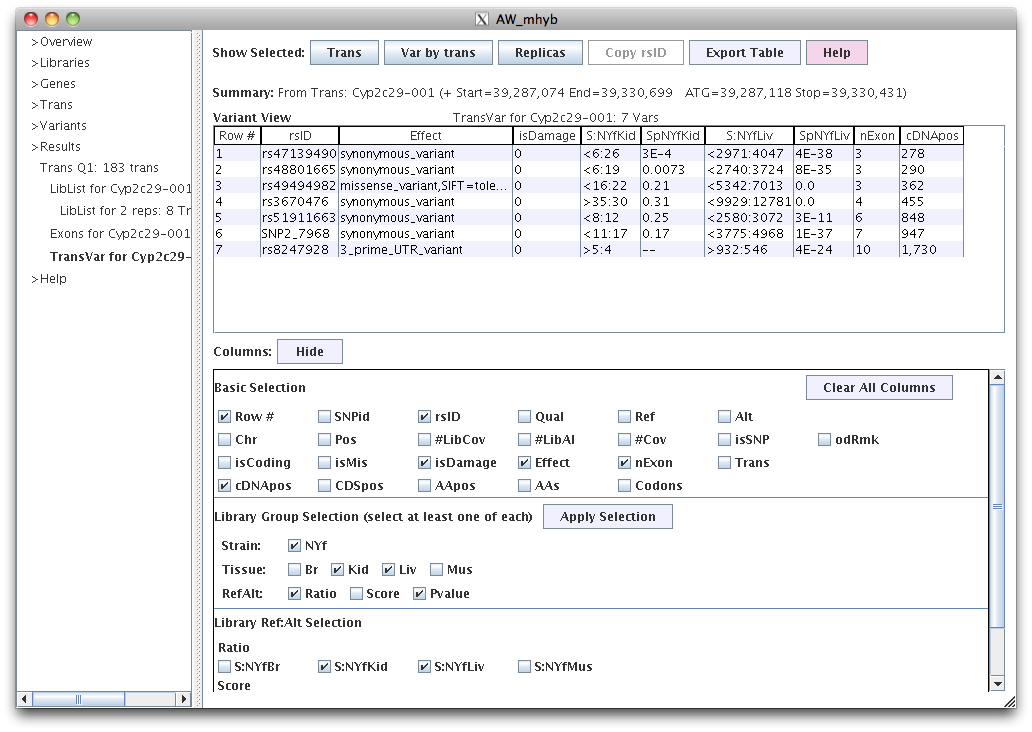
|
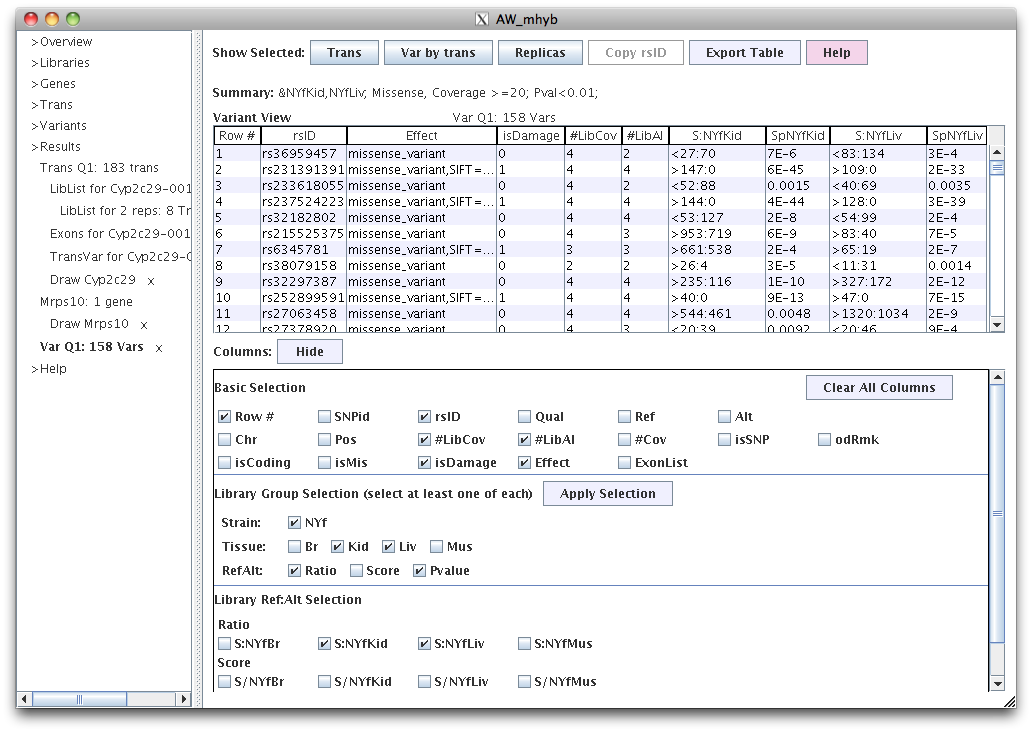
The columns starting with "S:" provides the ref:alt counts and columns starting with "Sp" are the SNP coverage p-values.
In the "Basic Selection" of the Column panel, the last two rows of columns are specific to the transcript.
|
|
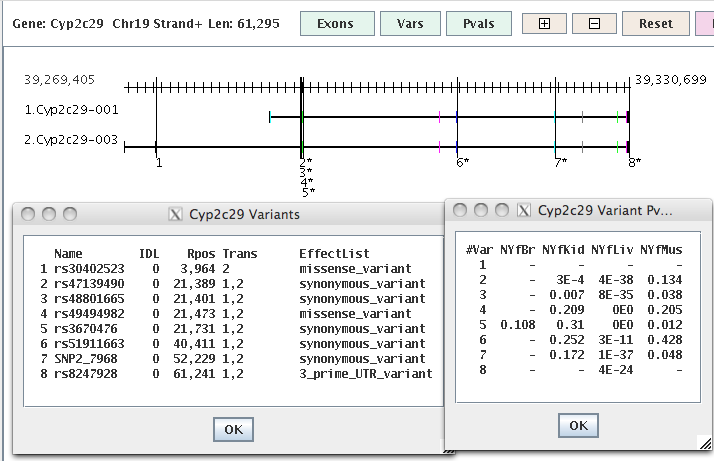
Ex 1. The vertical lines are the SNPs where an '*' indicates p-value<0.05 for at least one library.
Rectangles are exons, where black are non-coding.
|
|
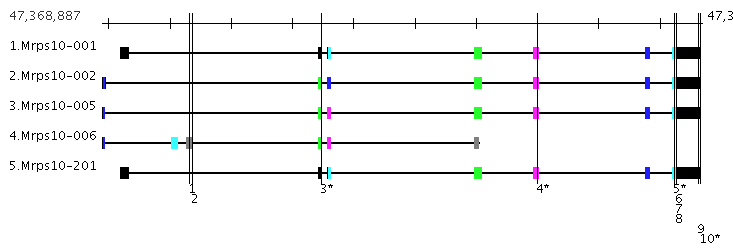
Ex 2. The coding exons are color coded where
exons in a stack are the same color if they have the same coordinates, else they have different colors, e.g.
the exons to the right of the SNP labelled '3*' has three different colors so its 3 distinct exons.
|
4. Variants
|
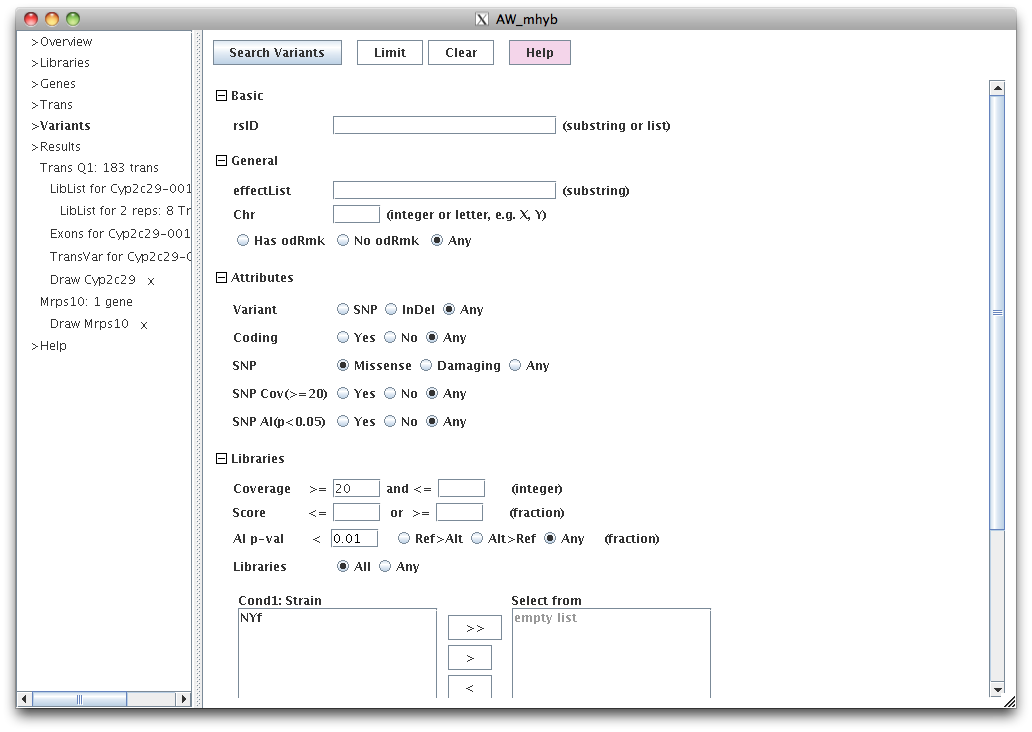
This set of filters will display all missense SNPs with AI p<0.01 for libraries NYfLiv and NYfKid.
The coverage<=20 is also set, but is redundant because a SNP will not have a p-value if it does not have
coverage<=20.
|
|
In the Columns panel, the "effectList" are the effects (e.g. missense) for all transcripts containing the gene.
The #LibCov is the number of libraries that have SNP coverage >=20 for at least one library.
The #LibAI is the number of AI(p<0.05) libraries.
|
The following are tables produced by selecting one or more rows following by the approproiate button at the top.
Trans for Variant vs Variant by Trans
| Go to top |
|
Trans Table showing the transcripts that contain the variants.
Most reads were assigned to the second two transcript isoforms of the gene, which
is why the first one has very few reads assigned to it.
|
|
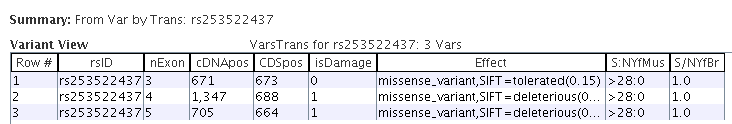
Variant table showing the selected variant by transcript.
The middle columns vary per transcript but the SNP coverages stay the same.
|
6. Genes, Libraries and Results
|
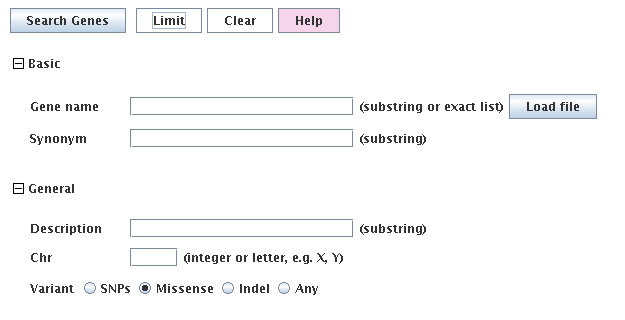
The gene query is not very extensive since there is an extensive transcript query.
The gene coordinates are the furthest left and right isoform coordinate, it contains all variants
within those boundaries, and its read counts are the summed counts of all transcripts.
|
|
The gene table is useful to drill down from gene to transcripts.
|

|
There is no special queries for libraries. This is the full library table which shows totals.
|
|
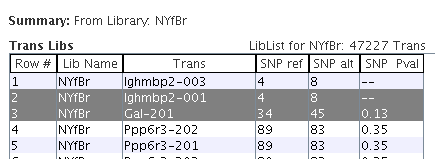
For the selected library "NYfBr", the Trans Libs table shows the library values for all transcripts.
|
|
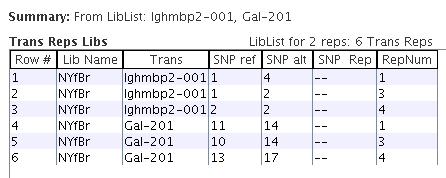
Selecting one or more transcripts, the Trans Rep Libs table shows the replicas for them.
|
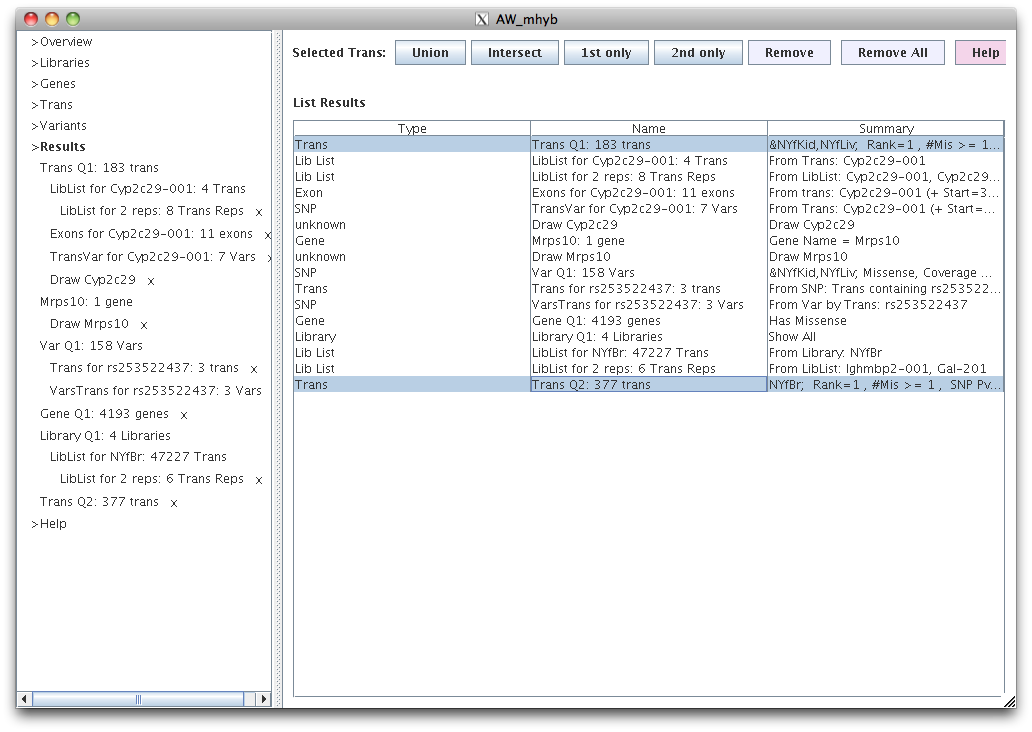
Tabs for all generated results are shown on the left with a Name. Selecting a tab shows the results on the right.
Any tab can be removed from the left panel by clicking the 'x' beside it, however, parent tabs (e.g. Trans Q2)
cannot be removed until its childern (indented beneath parent) have been removed.
Alternatively, the ">Results" can be selected to show the list of results along with their description. Selected results can be
removed, or all results can be removed.
For Type="Trans" only, two trans tables can be selected to invoke their union, intersect, 1st Only or 2nd Only
to produce a new table.
Go to top
|

