

| Demo_Seq-Demo_Seq2 Results | Synteny Results |
The first section provides results from the supplied demo, which is used by System Guide in discussion of running the demo.
The second section describes synteny results using the different options; it uses a chromosome from Arabidopsis thaliana and one from Brassica rapa.
Demo Results
| Two complete genomes | Draft | Self-synteny | symap.log |
This demo was created from real data >15 years ago, and is VERY obsolete - it is strictly for demonstration.
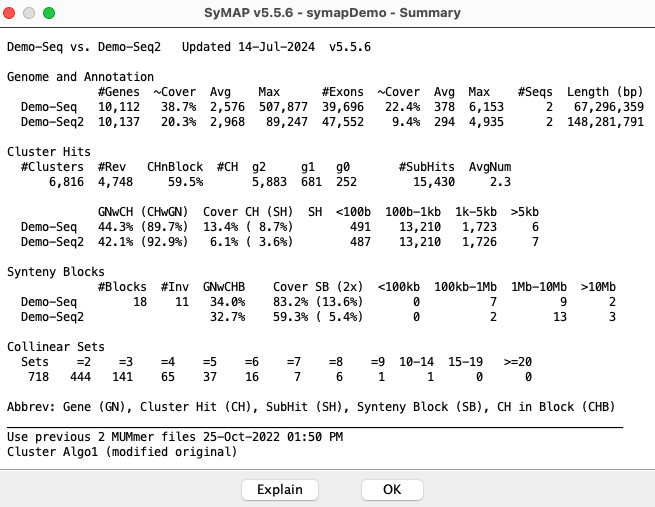
Two complete genomes: Demo-Seq to Demo-Seq2
| Click an image to view a closeup. | |
|
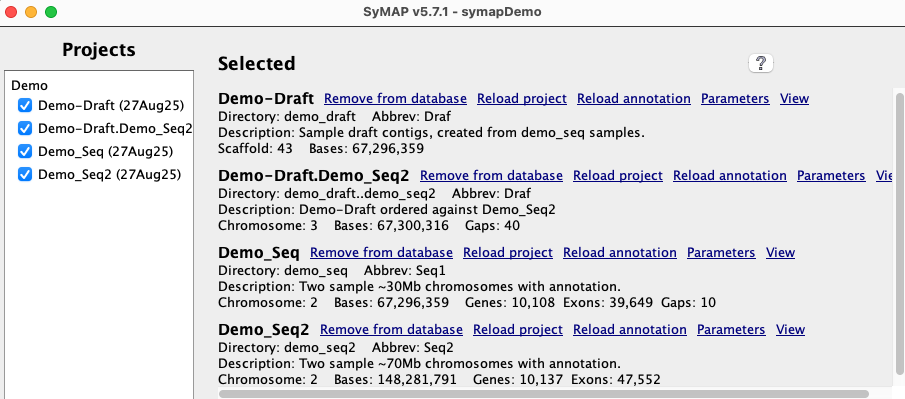
The demo that is provided with the SyMAP tarball has the projects The project This section discusses the
|
|
There are a variety of options, as discussed in
Pair Parameters.
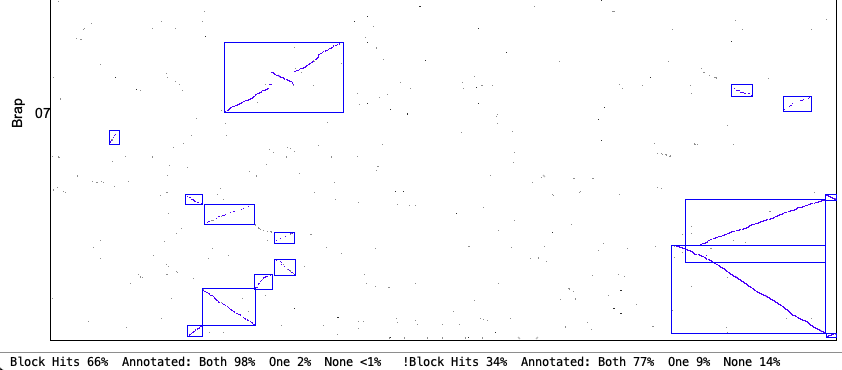
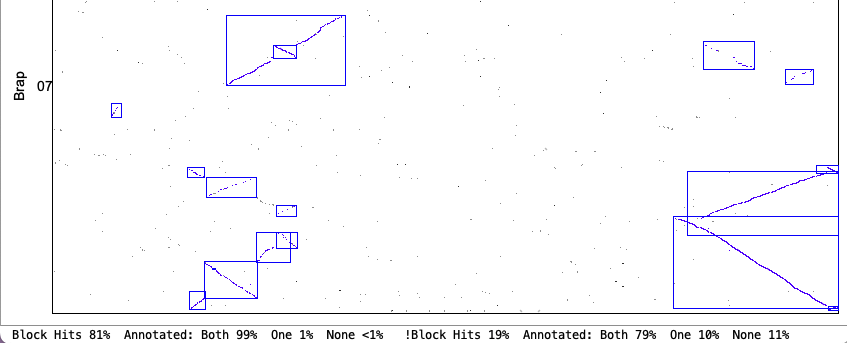
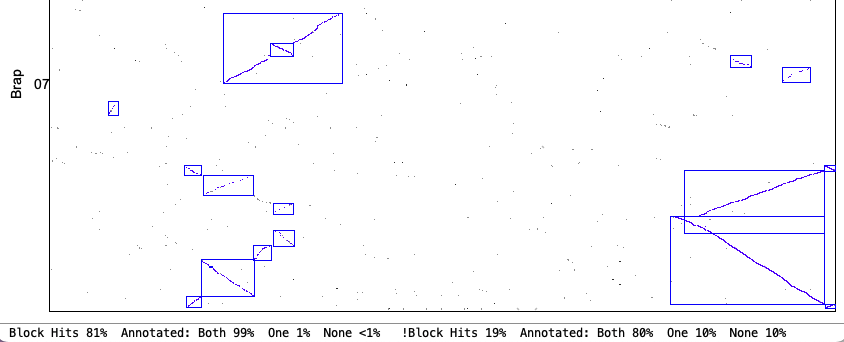
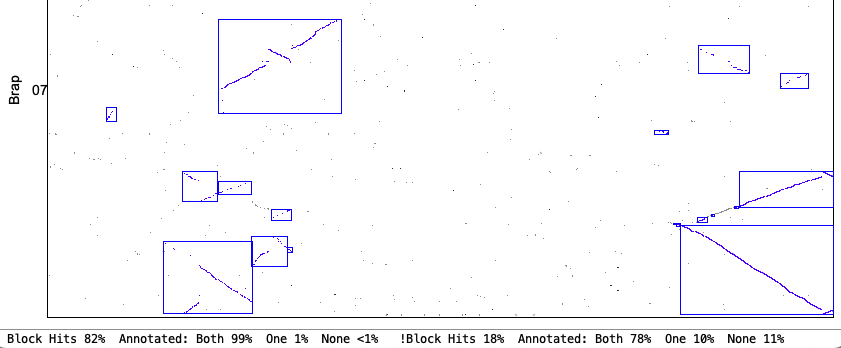
The following shows the
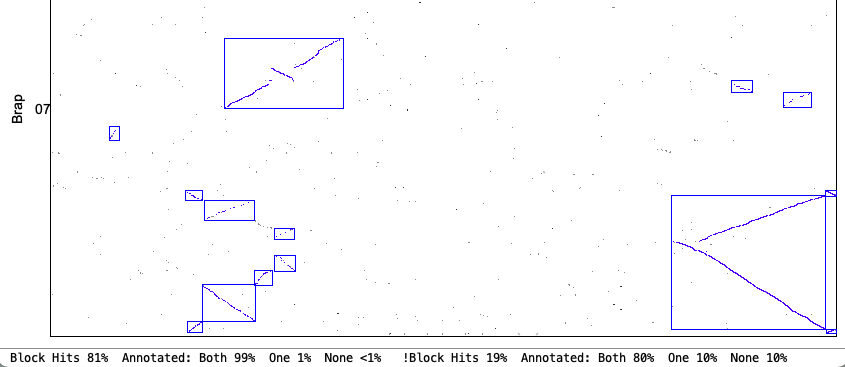
Cluster Algo1 (original modified) orCluster Algo2 (exon-intron) : The second is recommended when there is good gene annotation provided.Synteny Original orSynteny Strict : The second is recommended for complete genome sequence; it does not perform well for draft.
|
|

|
|
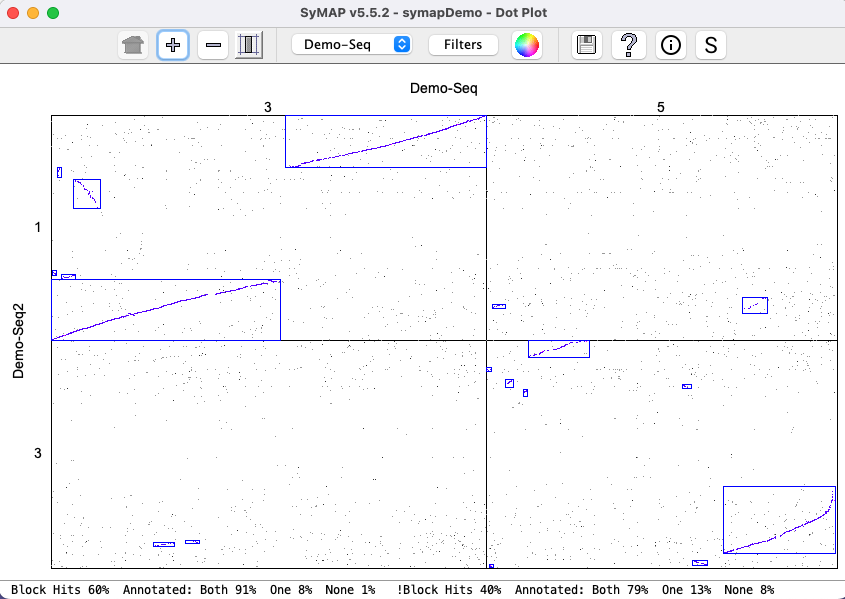
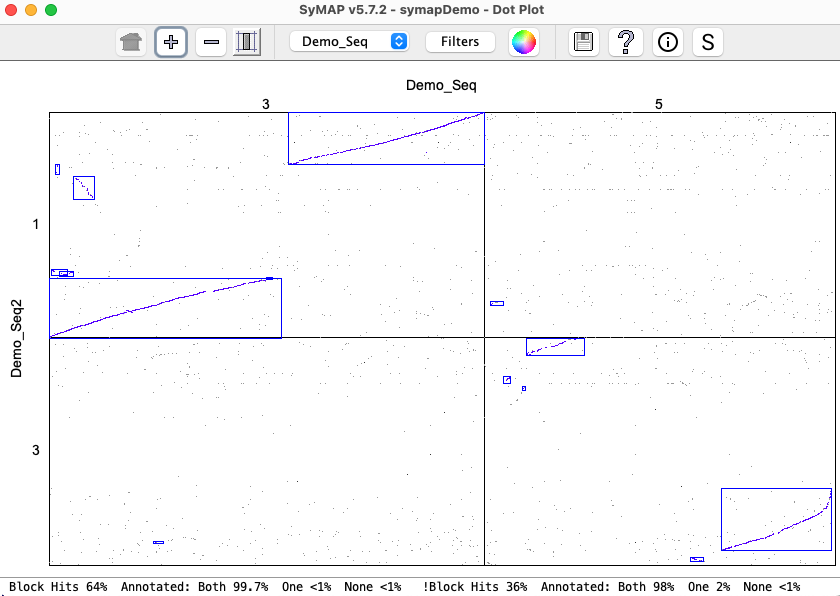
| There is very little difference between the | |
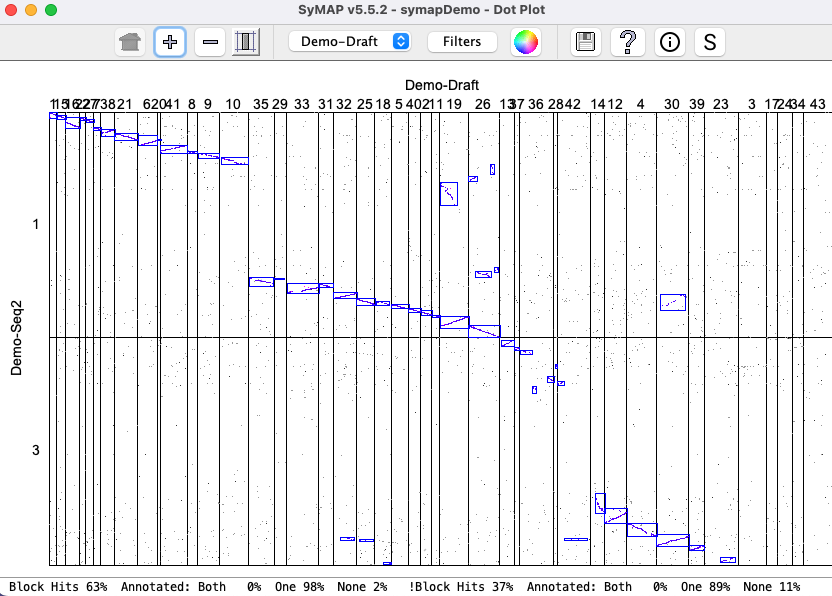
Draft: Demo-Draft to Demo-Seq2
| The Demo-draft was run against the Demo-Seq2 with its | |

|
|
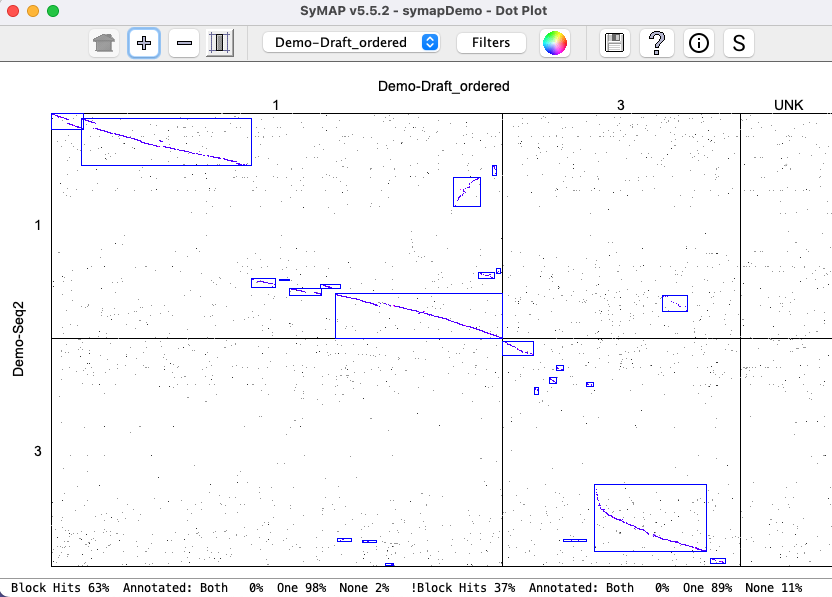
| When the ordering algorithm is run, it creates a new project called Demo-Draft.Demo_Seq2,
where the 43 contigs are written into three chromosomes; the first two correspond
to chr1 and chr3 of Demo_Seq2, and chr0 contains the contigs that do not align.
The new project Demo-Draft.Demo_Seq2 was aligned with Demo_Seq2, resulting in the dot plot shown on the right. | |
|
|
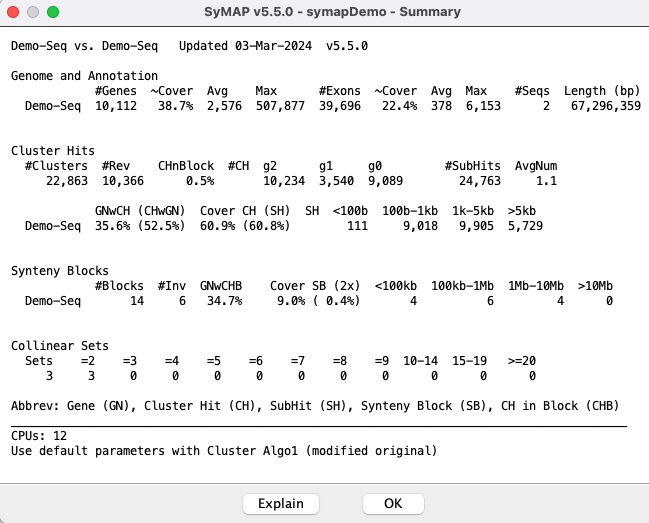
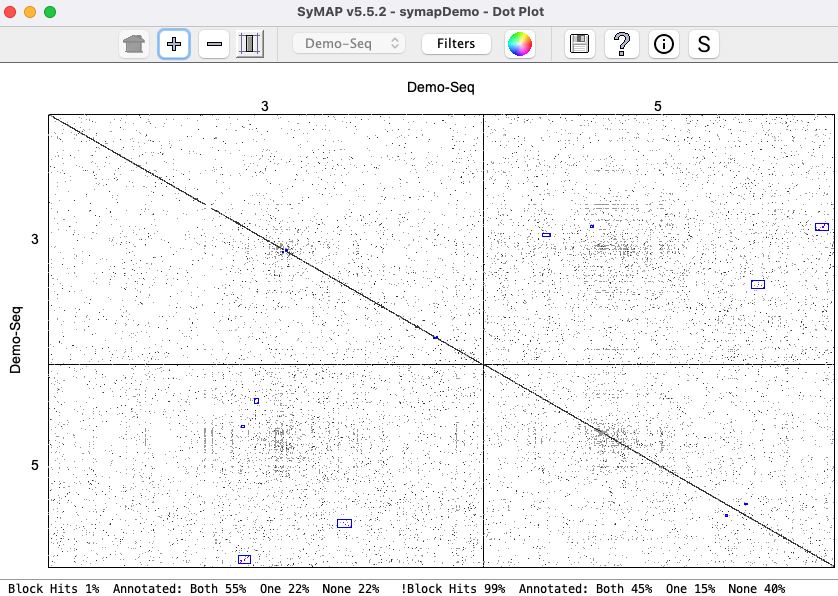
Self-synteny: Demo-Seq
| Demo-Seq has been run against itself. There are a few blocks, but these blocks are probably too small to be meaningful. The blocks below the diagonal are mirrored above the diagonal, e.g. 3.5.1 and 5.3.1 are the same. | |
|
|
symap.log
The following 4 sections show the contents of the| Algo1 !verbose | Algo1 verbose | Algo2 !verbose | Algo2 verbose | Go to top |
The parameters selected are:
 Use previous 2 MUMmer files 17-Aug-25 13:45   CPUs: 2
 Cluster Algo1 (modified original) or Cluster Algo2 (exon-intron)
  Synteny Strict
The 2 MUMmer files indicates the chromosome were not split and
Start calculating cluster hits for demo_seq and demo_seq2
   Alignment files in data/seq_results/demo_seq_to_demo_seq2/align/
   Scan files to create candidate genes from hits
    20,005 Total scanned hits from 2 files
   Scan files to cluster and filter hits
    11,000 Total cluster hits
     6,816 Filtered hits to save
   Finding Collinear sets
       717 Collinear sets
Finish clustering hits               8s

Finding synteny for demo_seq and demo_seq2
     	17 Blocks
Finish Synteny                       2s
Algo1 verbose
Start calculating cluster hits for demo_seq and demo_seq2
   Alignment files in data/seq_results/demo_seq_to_demo_seq2/align/
   Loading annotations
    10,108 demo_seq genes
    10,137 demo_seq2 genes
   Scan files to create candidate genes from hits
    14,058 scanned PROMER demo_seq_cc.demo_seq2_f1.mum
     5,947 scanned PROMER demo_seq_cc.demo_seq2_f2.mum
    20,005 Total scanned hits from 2 files
   Scan files to cluster and filter hits
     6,923 clustered demo_seq_cc.demo_seq2_f1.mum
     4,077 clustered demo_seq_cc.demo_seq2_f2.mum
    11,000 Total cluster hits
Filter hits
     8,556 for demo_seq
     7,350 for demo_seq2
     6,816 Filtered hits to save
Save results
   Save filtered hits
   Save hit to gene
     6,564  (6,375) for demo_seq
     6,564  (12,749) for demo_seq2
   Finding Collinear sets
       717 Collinear sets
     1,969 Updates
   Finish Collinear            0s
Finish clustering hits               8s

Finding synteny for demo_seq and demo_seq2
     6,817 Total hits
         4 group-x-group pairs to analyze
            7 Blocks chr3-chr1     Orient:  Same   3   Diff   4
            1 Blocks chr3-chr3     Orient:  Same   0   Diff   1
            1 Blocks chr5-chr1     Orient:  Same   0   Diff   1
            8 Blocks chr5-chr3     Orient:  Same   4   Diff   4
        17 Blocks
           10 Collinear Sets not in blocks (20 total hits)
Finish Synteny                       2s
Algo2 !verbose
Start calculating cluster hits for demo_seq and demo_seq2
   Alignment files in data/seq_results/demo_seq_to_demo_seq2/align/
   Final totals    Raw hits 20,005    Files 2                             .
     4,747 Clusters   Both genes     4,713   One gene        34   No gene         0
     6,914 Filtered   Both genes     3,263   One gene     2,453   No gene     1,198   Pile hits 0
   Finding Collinear sets
       635 Collinear sets
Finish clustering hits               9s

Finding synteny for demo_seq and demo_seq2
        14 Blocks
Finish Synteny                       1s
Algo2 verbose
Start calculating cluster hits for demo_seq and demo_seq2
   Alignment files in data/seq_results/demo_seq_to_demo_seq2/align/
   Load genes for Algo2
      Demo_Seq2  [Avg Min Max] [Gene 2,968  120   89k] [Intron   430    1   87k] [Exon   294    3 4,935] Cov 46.5%
      Demo_Seq   [Avg Min Max] [Gene 2,575   63  508k] [Intron   373    1  501k] [Exon   379    1 6,153] Cov 57.8%
   Load demo_seq_cc.demo_seq2_f1.mum  Hits 14,058 (EQ 2,893 NE 11,165)
        3,035 Clusters chr3-chr1     Both genes  3,022   One gene     13   No gene      0
          489 Clusters chr5-chr1     Both genes    484   One gene      5   No gene      0
   Load demo_seq_cc.demo_seq2_f2.mum  Hits 5,947 (EQ 2,366 NE 3,581)
          424 Clusters chr3-chr3     Both genes    417   One gene      7   No gene      0
          799 Clusters chr5-chr3     Both genes    790   One gene      9   No gene      0
   Final totals    Raw hits 20,005    Files 2
     4,747 Clusters   Both genes     4,713   One gene        34   No gene         0
     6,914 Filtered   Both genes     3,263   One gene     2,453   No gene     1,198   Pile hits 0
   Finding Collinear sets
       635 Collinear sets
     1,714 Updates
   Finish Collinear            0s
Finish clustering hits               9s

Finding synteny for demo_seq and demo_seq2
     4,747 Total hits
         4 group-x-group pairs to analyze
            7 Blocks chr3-chr1     Orient:  Same   3   Diff   4
            1 Blocks chr3-chr3     Orient:  Same   0   Diff   1
            1 Blocks chr5-chr1     Orient:  Same   0   Diff   1
            5 Blocks chr5-chr3     Orient:  Same   1   Diff   4
        14 Blocks
            6 Collinear Sets not in blocks (12 total hits)
Finish Synteny                       1s
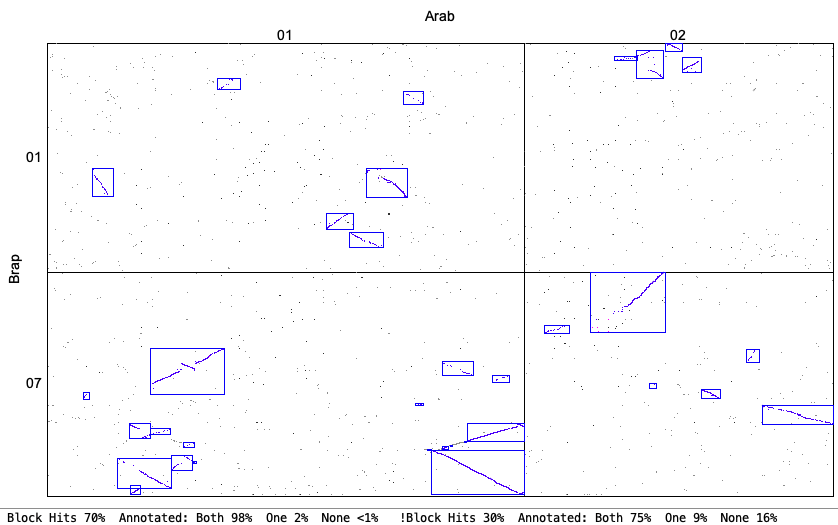
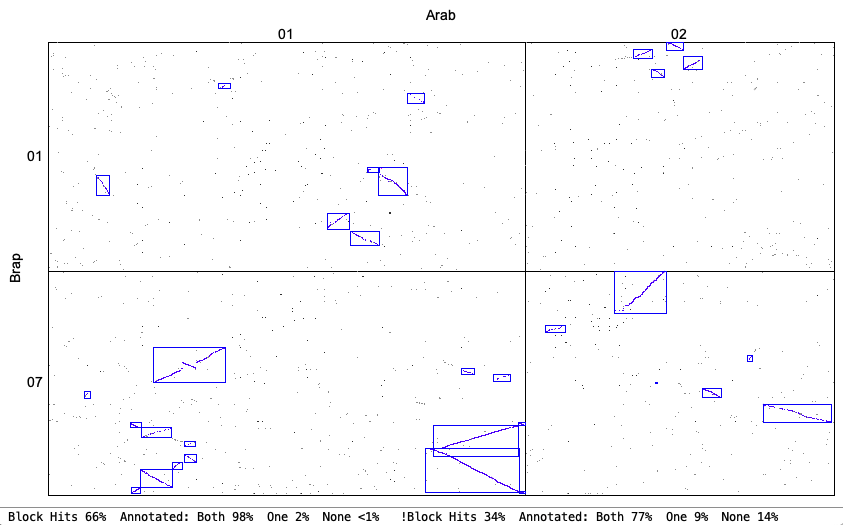
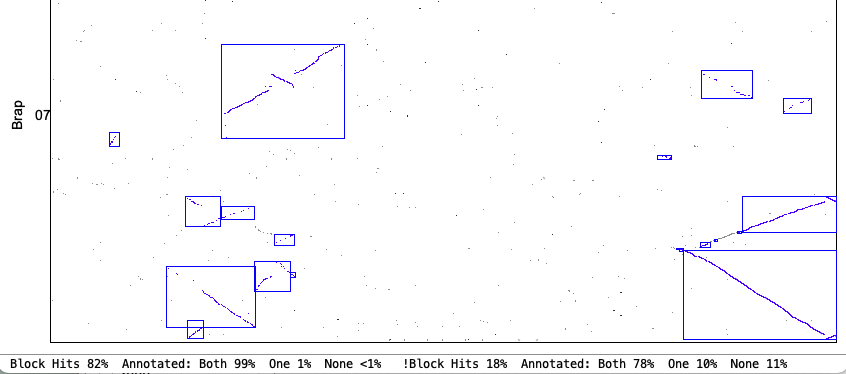
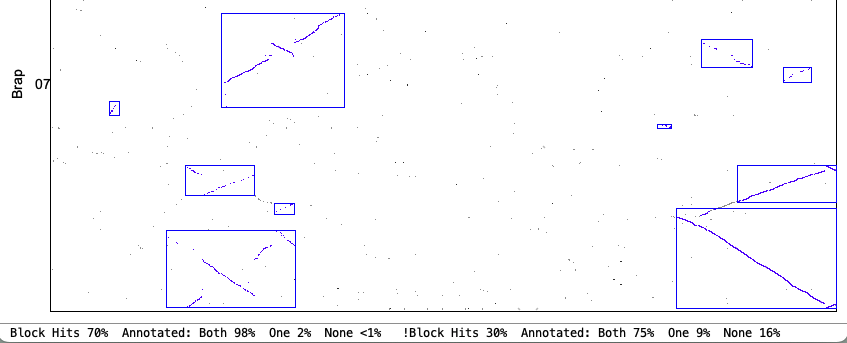
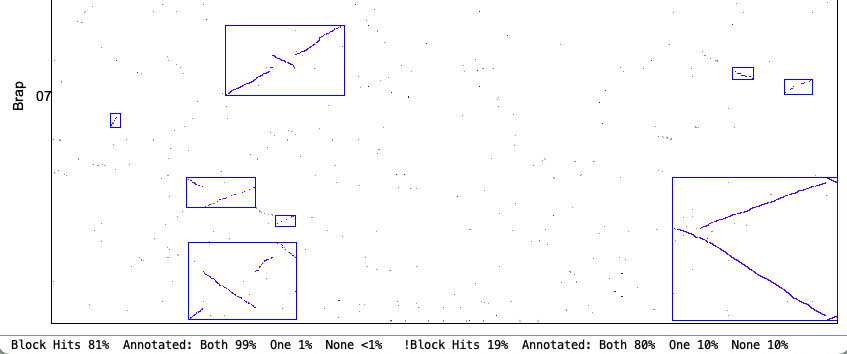
Synteny Results
The following is from comparing Arabidopsis thaliana chromosomes 1 and 2 with Brassica rapa chromosomes 1 and 7. The
| 
|
| 
|
| 
|
| 
|
| 
|
| Go to top |
Email Comments To: cas1@arizona.edu